Optum Review Reporting: Dashboard Design
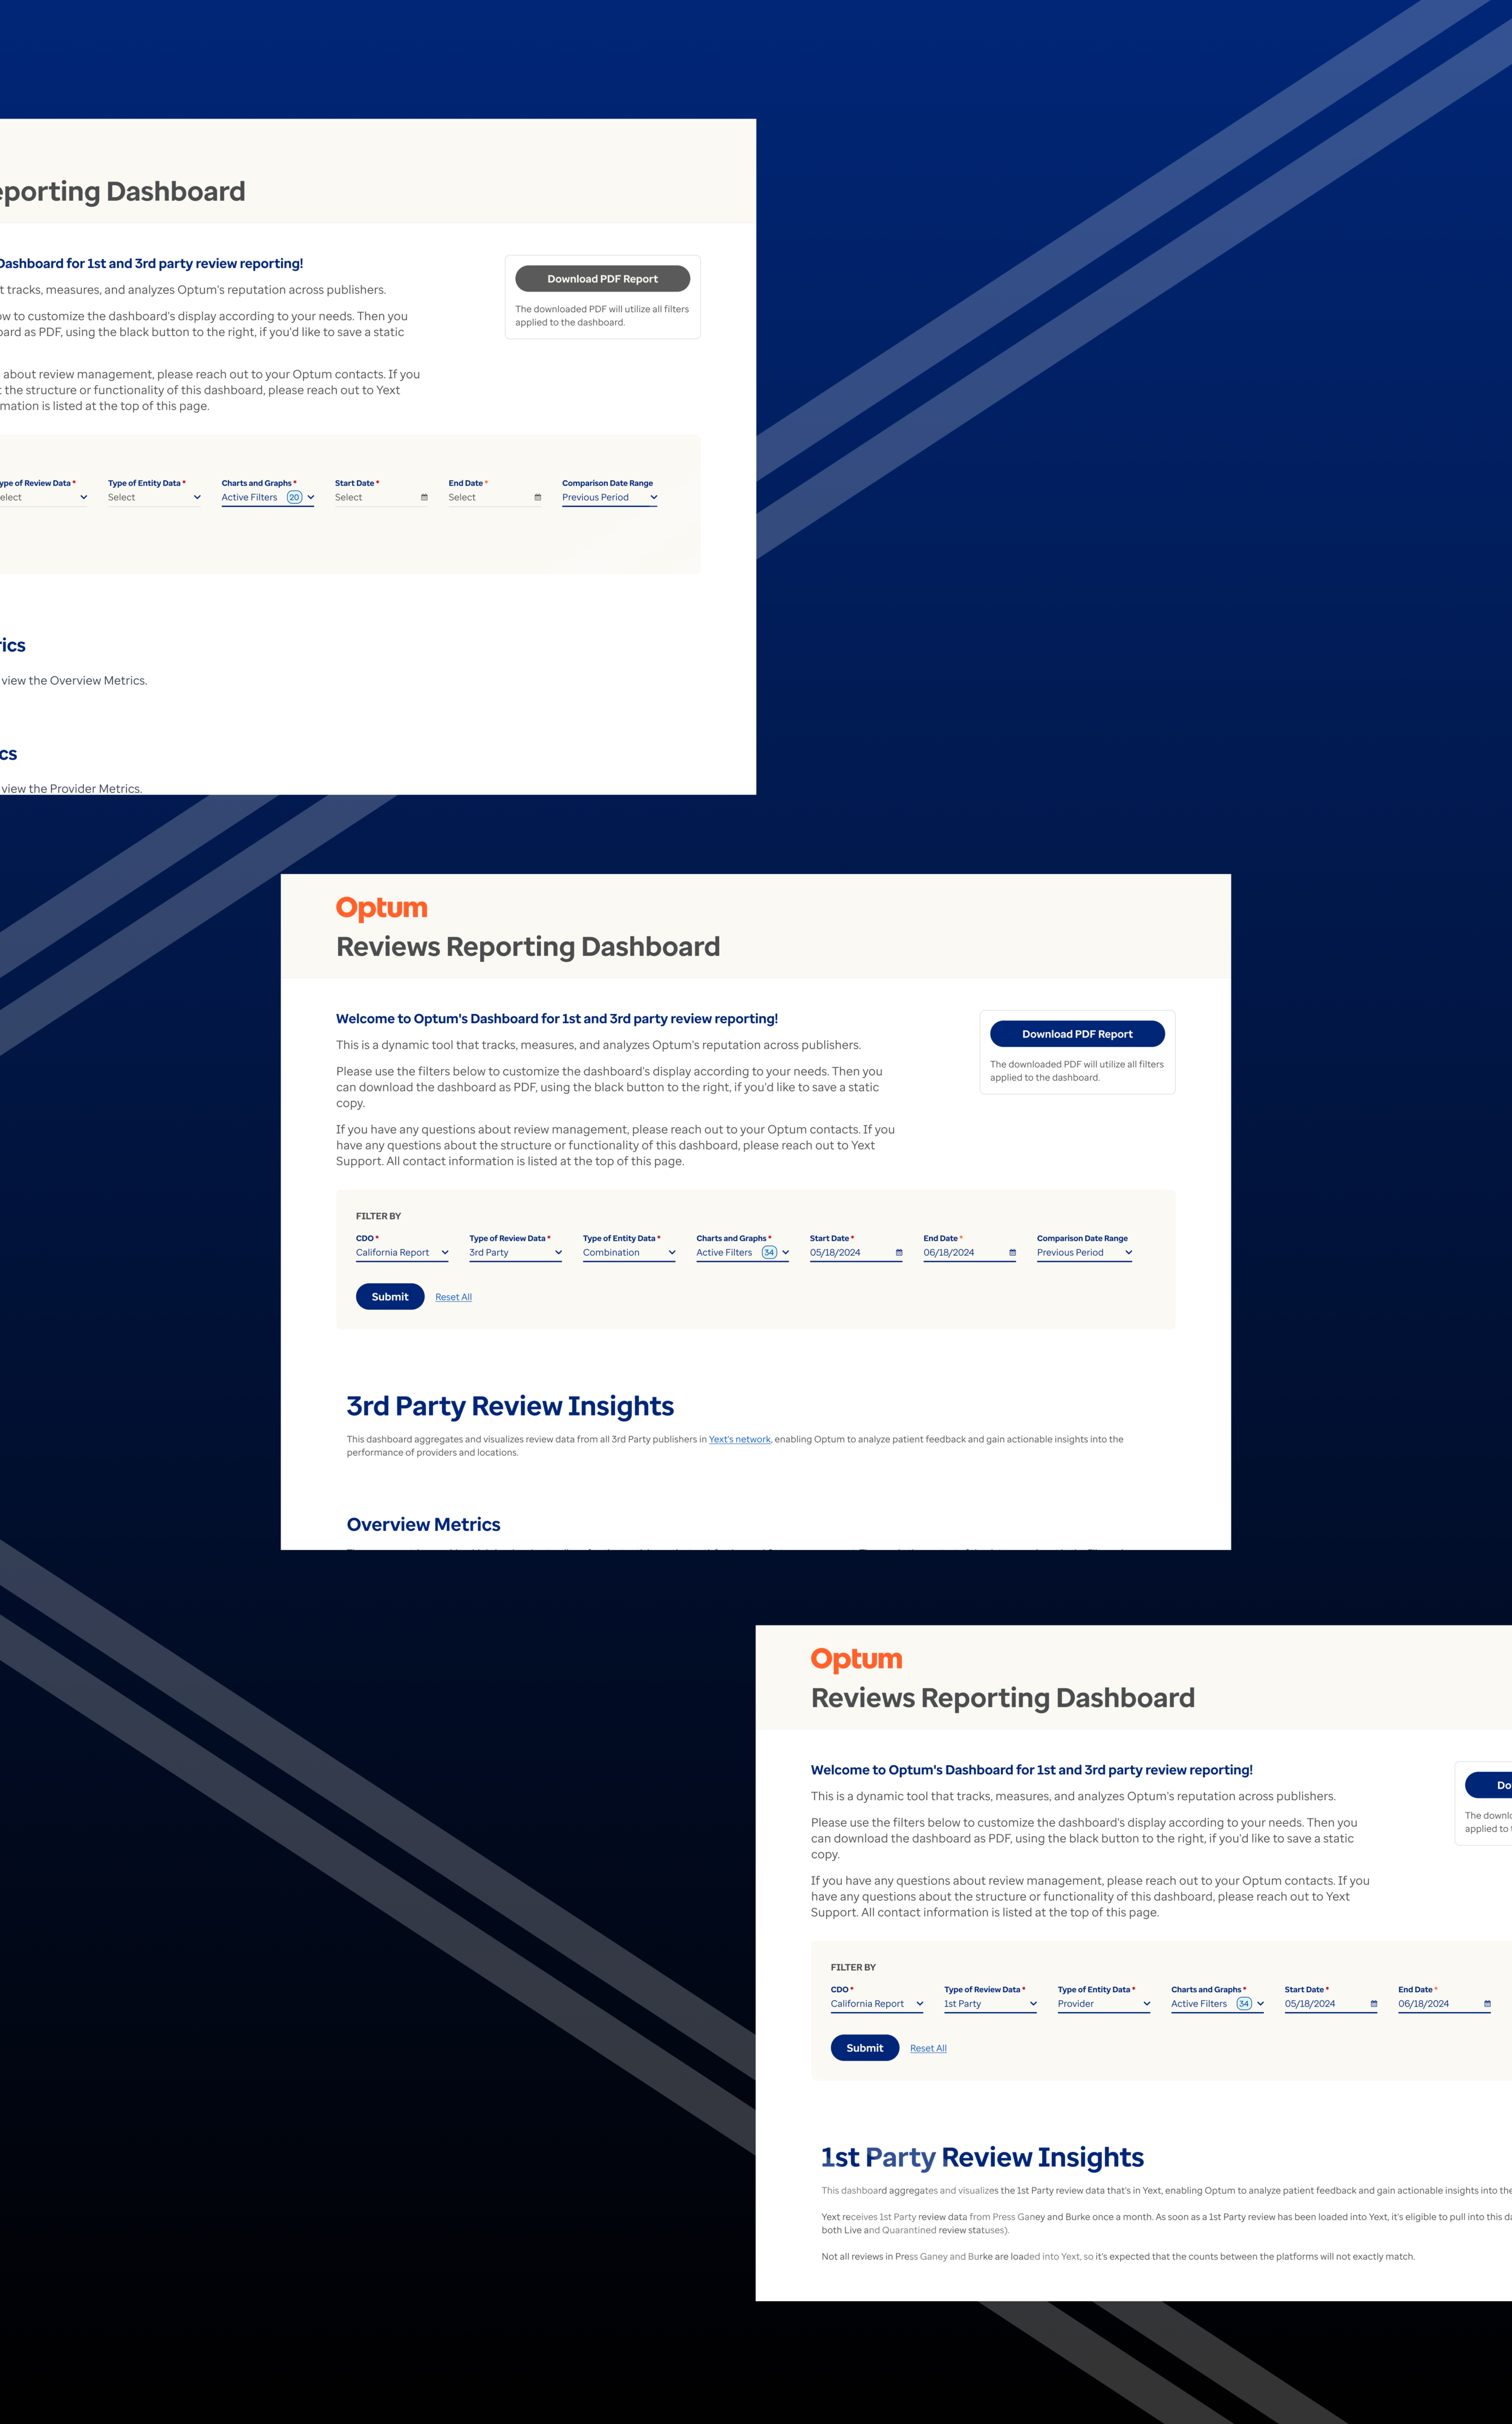
High fidelity, production ready, interactive designs for Optum’s review reporting to strengthen the value of the insights shared with their Care Delivery Organizations (CDOs), introduce flexibility to suit a wide range of audiences, consolidate the amount of notifications sent, and foster trust in the accuracy of the metrics shared.
Client: Optum
Project Duration: 4 months
Role: Lead Designer
.
01Context
Optum's existing reporting system was fragmented, comprising a mix of custom Snowflake reports and Excel documents dispersed among various stakeholders. The Optum team collected anonymized feedback from the participating markets in December 2023, which was used to influence this overhaul of review reporting. The Optum and Yext teams worked together to align on sections that needed to be optimized, added, and/or removed from the existing reporting in order to rebuild the reports on a single dashboard view.


-
Fragmentation of reporting on static PDFs or Excel sheets made it challenging for CDOs to obtain a comprehensive view of the data.
-
Develop a single, integrated dashboard that would streamline reporting processes and offer a more holistic view of the data.
-
How can we create a unified dashboard that is comprehensive, user-friendly and customizable?
User Research
The Optum team distributed a survey to gather valuable feedback from CDOs, aiming to understand their preferences and pain points regarding the current monthly third-party review report.
02Success Criteria:
CDOs find the review reports to be informative and helpful towards their reputation management strategy
Review reports suit a range of stakeholders (day-to-days and executives)
Pain Points:
Limited customization on data (sample size, time frame, trends, comparison date ranges)
Only one report for both 3rd party and 1st party data
Not easily accessible
Brainstorm // Ideation
Outlined the current reporting structure, various data types, client requirements, developer constraints, and outstanding questions for the client and PM in FigJam.
03


Digital Wireframes
Created low-fidelity wireframes in Figma to outline the dashboard's structure with all data requirements included. Presented the designs to receive client approval before moving forward.
04Wireframe for 3rd Party Review
Wireframe for 1st Party Review
Design Review // Iterations
Collaborated with the design team to further ideate various design options and move forward with the strongest design solutions during the second round of wireframes. Some designs decisions were also influenced based on developer constraints, such as filter structure and layouts.
05High-Fidelity Prototypes
Developed interactive prototypes using Figma. Went through multiple rounds of iterations, team brainstorms, design reviews and feedback. Created additional PDF mockups of the web dashboard.
05Filter flow: collapsed, expanded, default and error states
Content Mapping // QA
Collaborated with developers to verify the accurate implementation of the designs and prototype functionality.
06Conclusion
The Review Reporting Dashboard project for Optum exemplified the importance of an end-to-end design process, technical Figma skills, and organizing a robust design system. By thinking through various user journeys and iterating on multiple design stages with client feedback, we successfully developed a user-friendly, customizable dashboard that meets the needs of various stakeholders.
07-
The redesign was driven by user research and client feedback, ensuring that the final dashboard addressed real user pain points and needs.
Continuous collaboration with stakeholders and cross-functional teams throughout the process led to a more aligned and strategic redesign.
A more intuitive structure and layout were developed, making filters and data visualizations more accessible and easier to comprehend.
-
After implementation, we received a strong positive response from the CDOs and various stakeholders who use the dashboard with increased user satisfaction, increased data comprehension and high filter engagement.
With more time, I would refine the filter experience by testing alternate layouts and exploring a guided flow to make the initial page load experience more intuitive.
